Ceph is a distributed object storage technology. I’ve been working with it for nearly a year now and I can honestly say it is a beast. It takes a lot of time to get into all the details and I still know only the more high level functions of this masterpiece of open source development.
One problem I was confronted with quite early was: How to monitor the cluster health in a convenient way? Before I start to describe how I solved this problem, I want to say something about monitoring in general. Monitoring is kind of a religious things for Systemadministrators. If you’ve found something that fits for you, you will most likely stick to it, until death does you part from your monitoring system. So maybe the approach I was taking is not the right one for you. I will try to seperate things as good as possible, so you can adapt my solution to your needs.
Monitoring System
We use a more or less complex Icinga setup together with mod-gearman and a bunch of self written software that glues everything together. For example a custom gearman-worker which reads generated performance data from the gearman queue parses and transforms it and throws it at our graphite cluster. That gives us a lot of flexibility on what we want to do with that data later on. Another small piece of software integrates the graphite graphs neatly into the monitoring web interface (we use Thruk)
Existing Solutions
During my research I’ve found several Nagios/Icinga checks for monitoring a Ceph cluster. All of them had the same approach: The check is running locally on a ceph monitor node, executing the ceph status command. The check then parses the output and tells me if something is wrong or not.
Here are some examples:
Though this would have done the job, I didn’t like some aspects of it:
- Running checks locally is not cool. Especially in a distributed and redundant environment
- These checks only tell me if something is wrong, not what exactly
- The are no performance data gathered
Monitoring vs. Dashboards
Since using graphite, I’ve discovered my appreciation of fancy dashboards. If well designed, they show you at a glance if something is wrong and nearly instantly give you a hint what could have caused the problem.There are several Dashboards for ceph available, including Calamarie, the former Ceph Enterprise Dashboard which is now Open Source. I hate ‘em all. Why? Most of them use the ceph_rest_api which is plain crap (sorry, my oppinion) and you often have to click on something to see more relevant information. And in case of Calamarie you have to setup a bazillion things to use it. I wanted to have something that is strictly read-only and shows me everything on one clear to read page. And additionaly, it would be cool to use it for automated monitoring approaches as well!
Ceph-Dash
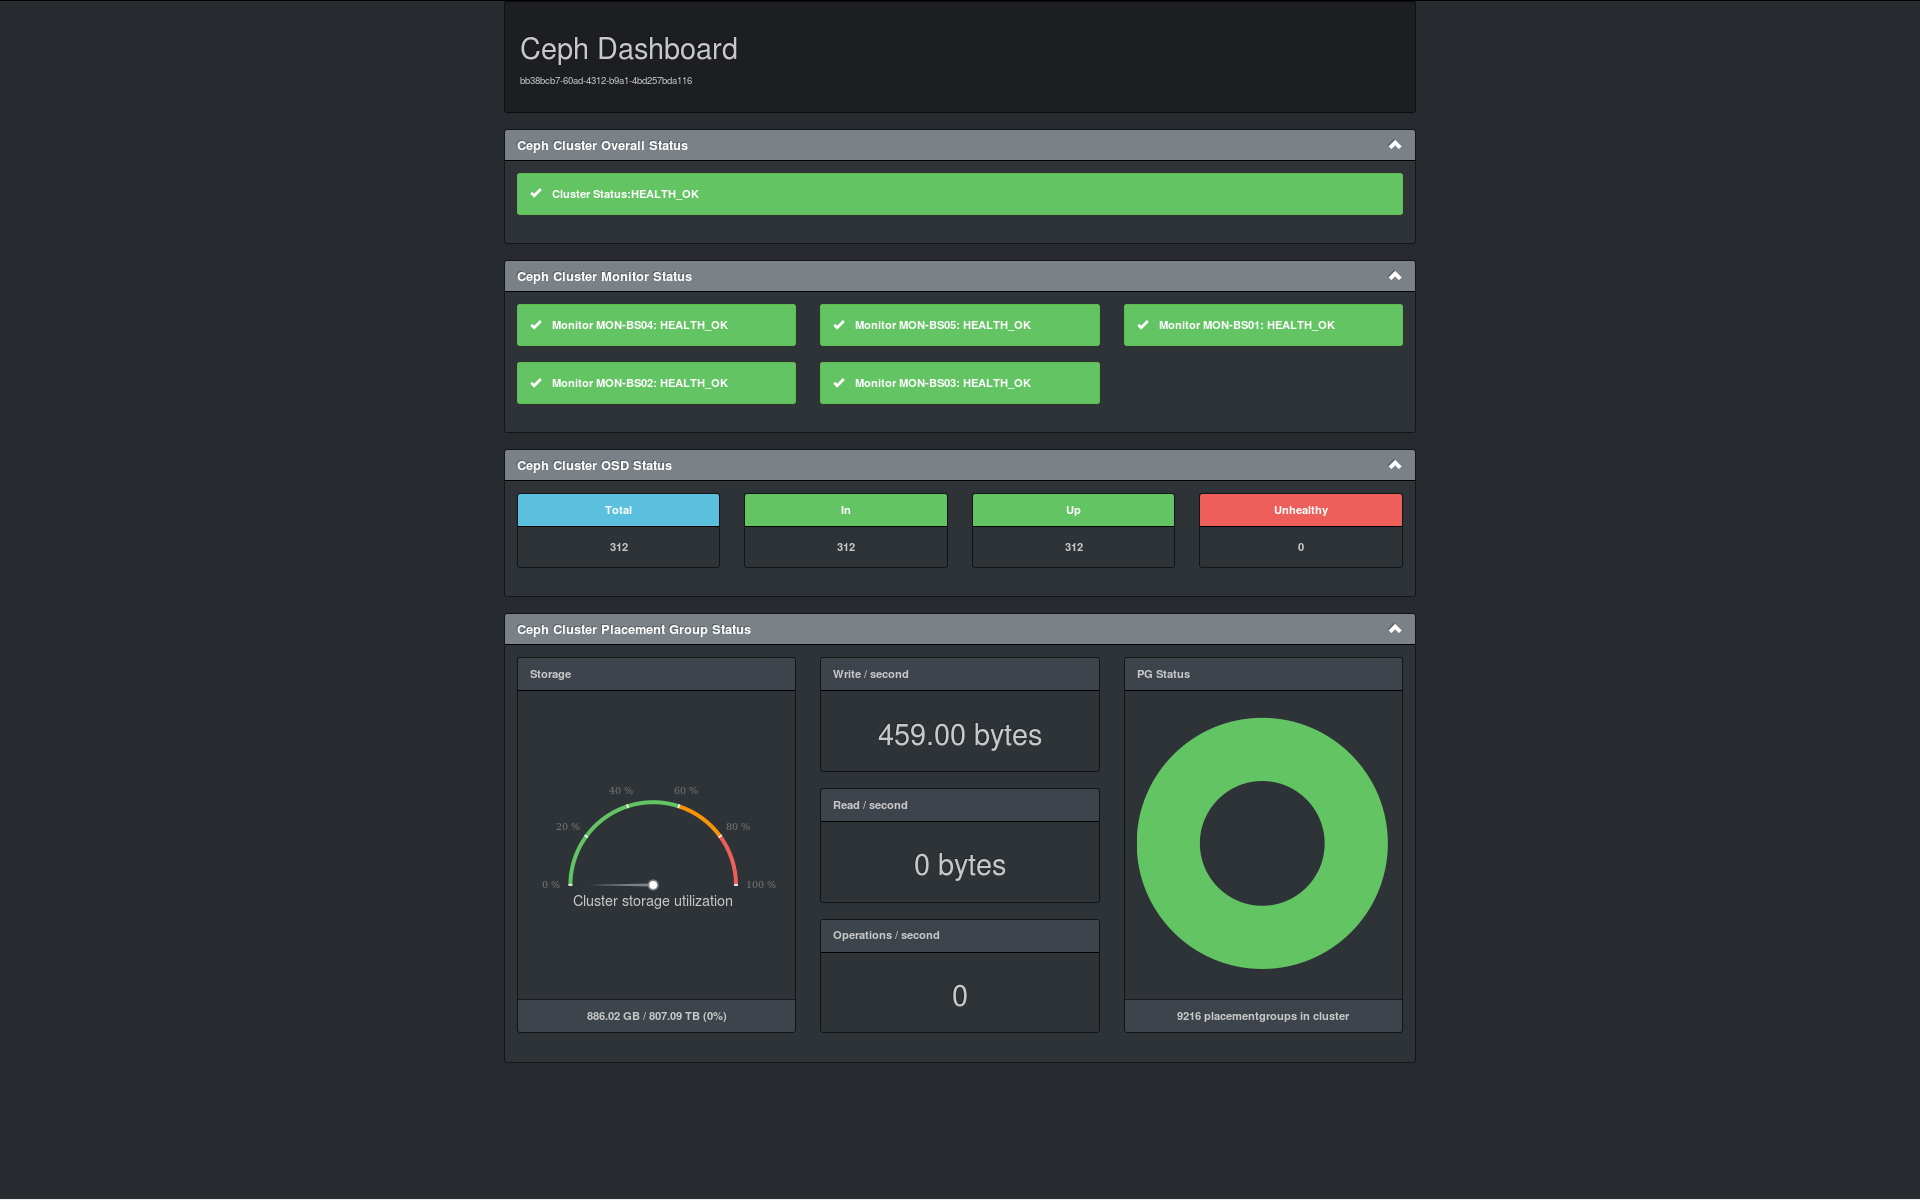 I did what I like to do so much: Creating something new. The result can be found on github in the form of Ceph-Dash. Ceph-Dash does not depend on the ceph_rest_api. It is a Flask based WSGI application, that can (and should) be deployed into Apache or Nginx. Calling it via Web-Browser will show a (hopefully) usefull and clean dashboard containing all relevant health information about your precious Ceph cluster. All you need, is a system which has a
 ceph.conf, a ceph keyring (user only needs read privleges) and python-ceph installed. For testing purposes you can just fire it up and Flask will bring up a simple HTTP server on port 5000, where you can check if everything wroks. If you call this url with Content-Type: application/json, you will get all the information as a json formatted output, which you can use for further (automated) processing. For example for a Nagios/Icinga plugin?
Check Ceph-Dash
Indeed! I’ve also provided a Nagios plugin for use with Ceph-Dash, called check_ceph_dash. Due to it’s nature, it can be triggered remotely. We have five ceph monitors and use a loadbalancer to distribute requests to Ceph-Dash to these monitors. Which means if some of them go down, the Nagios check will still work, since it will talk to the loadbalanced high-available address. It also provides a lot of performance metrics which we will feed into graphite to do more cool stuff with it.
Graphite/Grafana
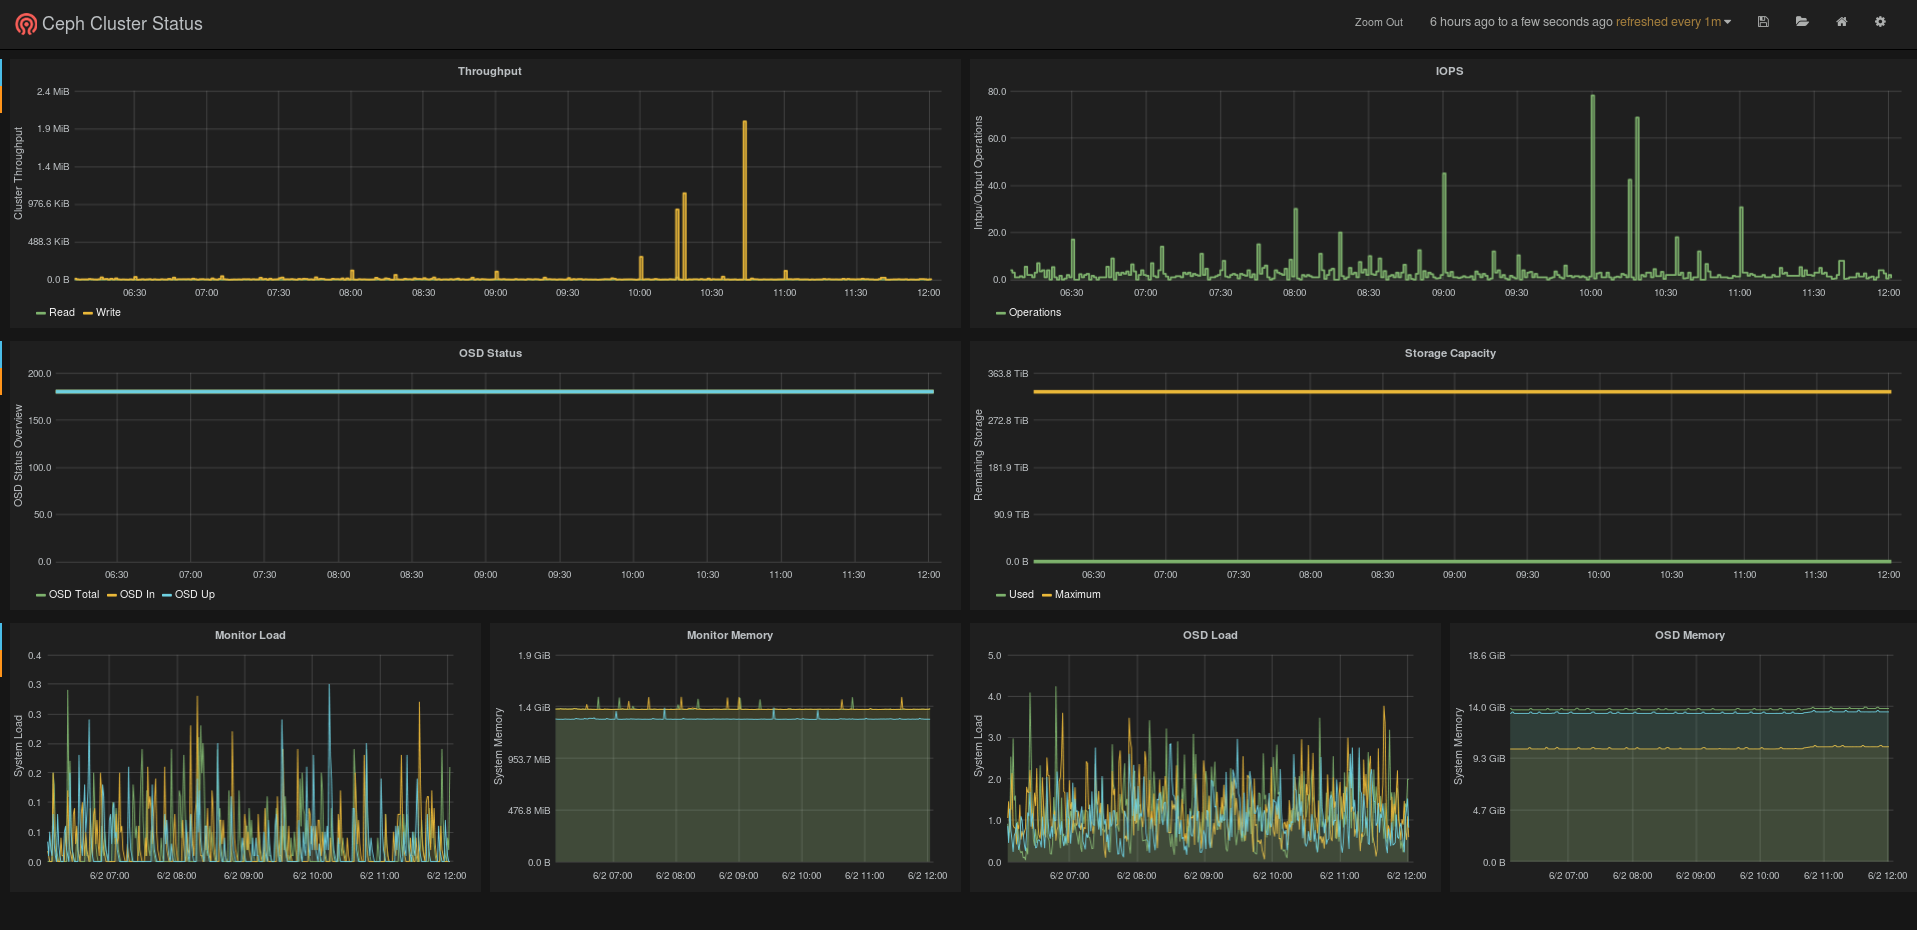 Once in graphite, we use the data to build another dashboard in Grafana. It’s up to you what information you want to monitor. For an example on how your Grafana dashboard might look like, I’ve provided a screenshot of ours. Of course you can use the native graphite dashboards as well, or for example use the really cool Graphene library. We use a check interval of 60 seconds in out Icinga setup, so the values in our dashboards are quite precise and up to date.
Integration
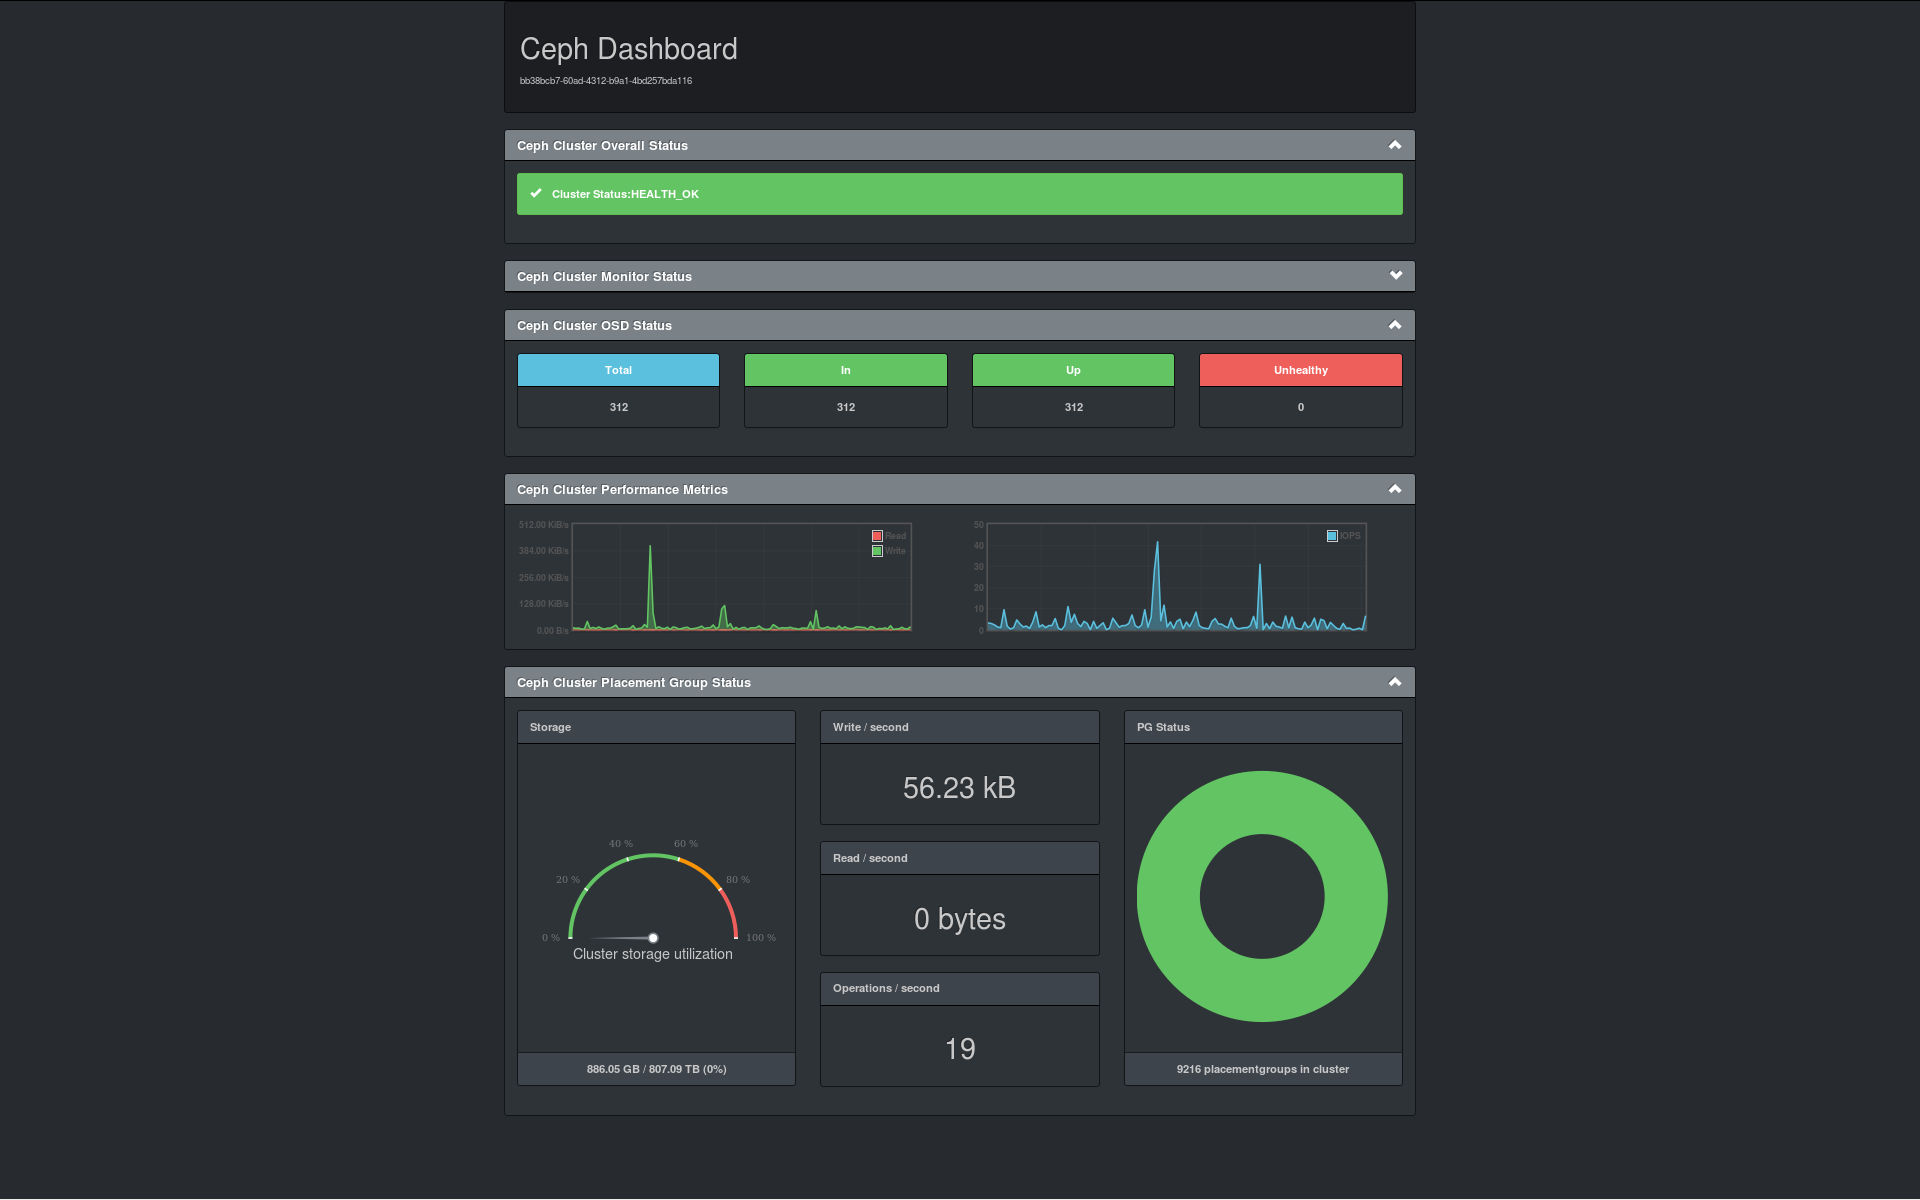 As I’ve mentioned before, I wanted as much information as possible on one single page. So I decided to use the awesome D3 library to integrate the graphite data into Ceph-Dash. So if you have any kind of graphite source that you want to display in Ceph-Dash (it doesn’t matter if the data is gathered via check_ceph_dash or in any other way) you can do this by configuring the graphite section in the configuration file.
If you are giving Ceph-Dash a shot and want to share your experiences or report bugs or any kind of strange behaviour, you can contact me via github. Even more welcome are people who want to contribute and send patches or implement new cool features! I hope the article will be usefull for someone out there and will help to tame the beast called Ceph.