I’ve noticed that I’m running late for my obligatory one blogpost per year, so I decided I could share my current experience with monitoring volatile infrastructures. Or in other words monitoring in a constantly changing environment, where nodes and container can appear and disappear anytime. The challenge here is not only to automate the whole monitoring process but also to decide if it is an error when a node suddenly disappears or if it is just part of a normal downscaling process.
Although you can still use check-based monitoring systems in such an environment, metric based monitoring is much more dynamic and flexible. You are just gathering all the metrics you can get from whatever appears in your infrastructure and then decide later what to do with it. In this blogpost I want to give an example of a full-stack metric based monitoring solution. As usual, most of the parts are interchangable. So if you like $INSERTYOURTOOLHERE more, you can use it, as long as it is able to genereate metrics for the metric backend.
So here is the list of tools I am going to describe and integrate:
- InfluxDB (Timeseries Database)
- Telegraf (Metric Collector)
- Kapacitor (Data Processing Engine)
- Alerta (Alerting Dashboard)
- Grafana (Metric Visualization)
- Python (Because I like it)
All of the tools listed above have APIs which allow you to automate rollout and configuration processes. All the InfluxData products are simply GO binaries and start by using one configuration file. This can be automated easily by any available configuration managemant (even with Ansible…).
InfluxDB
Ok, lets get started. First we are going to setup the InfluxDB. This will be our central point where we keep all of our metrics. Almost every other component in this setup is interchangeble, but this should be used as a backend. If you prefer other Timeseries Databases, I am sure you can work with them as well. But since the guys behind InfluxDB did a great job building their TICK Stack it is by far my preferred solution. You can download the appropriat package for your operatingsystem on their website and install it. InfluxDB runs out of the box and generally needs no further configuration. Conveniently, the database is able to understand several protocol, besides it’s on http based interface. If you are already collecting metrics via Graphite or using CollectD as a metric collector, you can easily configure InfluxDB to store their data by simply enabling the corresponding inputs in the config file /etc/influxdb/influxdb.conf:
[[collectd]]
  enabled = true

[[graphite]]
  enabled = true
This will open additional (configurable) ports where you can point your metric sources to. No further migration required!
Telegraf
Telegraf is a metric collector, similar to CollectD or Diamond. It already provides a ton of usefull input and output plugins and can be easily extended. It comes from the same developers that designed the InfluxDB so they work very well together. Which is important! I learned the hard way that just storing data in your TSDB doesn’t mean you can do anything useful with them afterwards. They should use proper field names and tags to be usefull for monitoring and graphing. Using the already implemented Telegraf plugins keeps that kind of struggle away from you, since they know what they are doing (most of the time). But like I said, this component can be easily traded for your favourite metric collector.
Configuration is as easy as editing one config file and enabling the input that you want to collect. Want to monitor Kubernetes, including pods and containers? Here you go!
[[inputs.kubernetes]]
  url = "http://127.0.0.1:10255"
The only thing left is to point Telegraf at your InfluxDB and maybe provide some global tags that get added to every single metric to make grouping and selecting even easier:
[global_tags]
  cluster = "021"
  datacenter = "murika"

[[outputs.influxdb]]
  username = "user"
  password = "passw0rd"
  urls = ["http://influxdb.mycorp.net:8086"]
  database = "telegraf"
Kapacitor
Here are things getting a little bit trickier. Kapacitor is a service that subscribes to databases in our InfluxDB, which means that any data that is inserted into said databases is also mirrored into Kapacitor. It then uses so called TICKScripts to evaluate the incoming data, transform it, join it and finally decide if something needs our attention. Since I struggled here for quite a while to get things up and running, here is a little more in depth walkthrough.
Getting Kapacitor up and running is as easy as for all the InfluxData tools: download the appropriate package for your system, install it and edit the configuration file to point at your precious InfluxDB:
[[influxdb]]
  username = "user"
  password = "passw0rd"
  name = "influxdb"
  default = true
  enabled = true
  urls = ["http://influxdb.mycorp.net:8086"]
Right now kapacitor is seeing all of the traffic that goes through your InfluxDB. And thats it. It does acutally nothing. Not cool? Right. So now we are writing some fancy TICKScripts to do some actuall alerting. As an example, we want to monitor the disk usage and alert if a disk is 80% full (Warning) or 90% full (Critical).
// Parameters
var warn = 80
var crit = 90

var period = 10s
var every = 10s

// Dataframe
var data = stream
  |from()
    .database('telegraf')
    .retentionPolicy('autogen')
    .measurement('disk')
    .groupBy('host', 'cluster', 'datacenter')
  |window()
    .period(period)
    .every(every)
  |mean('used_percent')
    .as('stat')

// Thresholds
var alert = data
  |alert()
    .id('{{ index .Tags "host"}}/disk_used')
    .message('{{ .ID }}:{{ index .Fields "stat" }}')
    .warn(lambda: "stat" > warn)
    .crit(lambda: "stat" > crit)

// Alert
alert
    .log('/tmp/disk_alert_log.txt')
Be sure that you gather this metric via Telegraf by enabling the disk plugin:
[[inputs.disk]]The Parameters section should be obvious. Here we are defining some variables that are used in our script later on. The Dataframe section is a bit trickier. The TICKScript language is an invocation chaining language. So coming from the stream of data, we are selecting all data coming from() the database telegraf in the retention policy autogen (autogen is the default retention policy that is automatically generated when creating a database and has an infinite TTL). We are looking into the measurement() disk, which is where our disk usage informations are stored and grouping by some tags. Important: If you want to access tags from your measurements anywhere in your TICK script, you have to group by them. Otherwise they will not be available. Then we select the time window Kapacitor should take a look at: check the data from the last 10 seconds every 10 seconds. Finally we are looking into the used_percent field to get the used percentage metric and make it available under the name ‘stat’.
If you would have gathered that data from your InfluxDB directly via InfluxQL it would look like this:
SELECT mean(used_percent) as "stat" FROM "telegraf"."autogen"."disk" GROUP BY "host", "cluster", "datacenter"Now that we have our data, we can check if we are exceeding our thresholds and create an alert(). Every alert should have uniqe ID, which is created via the .id() property. The .message() property defines a message (duh) with some human readable stuff to inform you about what is currently burning and where. The .crit() and .warn() properties are the actuall “check”. We test if our metric is exceeding our defined thresholds and issue a corresponding alert. For now by just writing to a temp file.
This works quite well for most threshold checks (like Memory, CPU and Load metrics). When we come to customizations I will show some other examples on how to utilize this highly flexible (and highly complex) alerting method.
But now we need to get this script running inside of Kapacitor. Save it on the host running Kapacitor as disk.tick and use the command line tool kapacitor to insert and enable it:
kapacitor define disk -type batch -tick disk.tick -dbrp telegraf.autogen
kapacitor enable disk
That’s it! As soon as one of your monitored disk fills up beyond 79% you should find a file in your /tmp directory containing your alert. You can find this and similar alerting examples in Kapacitors Github Repository.
Alerta
Alerta is one of the (suprisingly) very few general purpose alerting dashboards out there. And honestly, it’s a bit a pain in the ass to setup. It uses MongoDB as a backend, supports different kinds of authentication and looks quite nice.

The by far easiest way to get alerta up and running is by using the provided Docker Container and following the provided steps. I was setting it up via Salt to run via mod_wsgi in Apache in an environment that has no public internet access. And that wasn’t that funny. So do yourself a favour and use the Docker container to make your life less painfull. The container will expose the web frontend via port 80 and the API via the /api endpoint.
As soon as we have Alerta running, we want Kapacitor to send alerts to our new fancy dashboard. Add the following section to your /etc/kapacitor/kapacitor.conf:
[alerta]
  url = "http://alerta.mycorp.net/api"
  enabled = true
  origin = "Kapacitor"
After a restart we can modify our TICKScript to send alerts to Alerta by exchanging:
// Alert
alert
  .log('/tmp/disk_alert_log.txt')
with:
// Alert
alert
  .alerta()
    .resource('{{ index .Tags "host" }}')
    .environment('{{ index .Tags "cluster" }}')
    .message('Disk usage is {{ .Level }}')
    .group('{{ index .Tags "datacenter" }}')
    .value('{{ index .Fields "stat" }}')
Save the changed script and inform kapacitor about the changes:
kapacitor define disk -type batch -tick disk.tick -dbrp telegraf.autogen
kapacitor enable disk
Kapacitor will update the already existing disk task with the new informations. From now on, new alerts should appear in your Alerta Dashboard. Congratulations, your metric based alerting chain is now complete! Time for some eyecandy!
Grafana
Grafana is a really awesome way to visualize any kind of metrics. It supports different Backends and has a great query editor included if you decide to use InfluxDB as one. Installation is thankfully quite simple: download your appropriate package, install, start, done! The default port for Grafana is 3000 and the default credentials are “admin:admin”. After logging in you go to “Data Sources” and add your InfluxDB with the database “telegraf”. Now you can create dashboards as your heart desires! For automation puposes, Grafana provides an API which you can use to create datasources and dashboards.
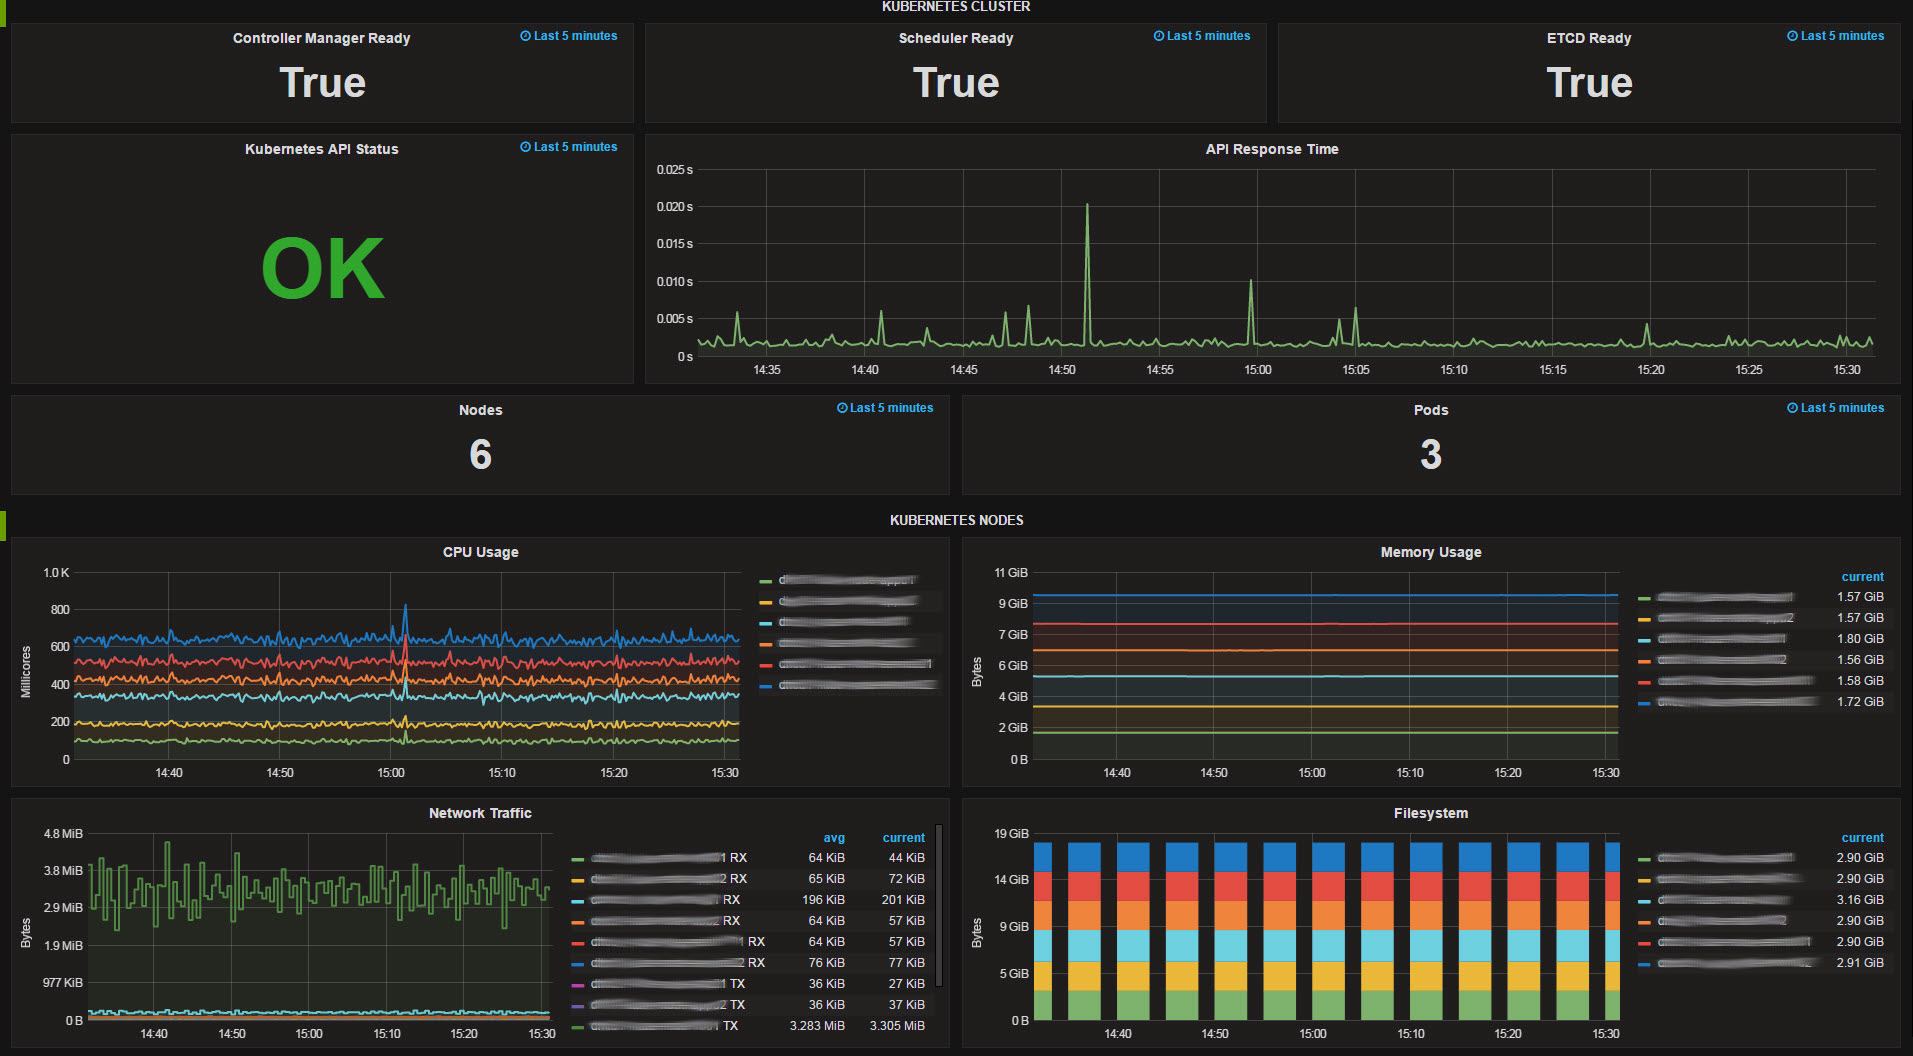
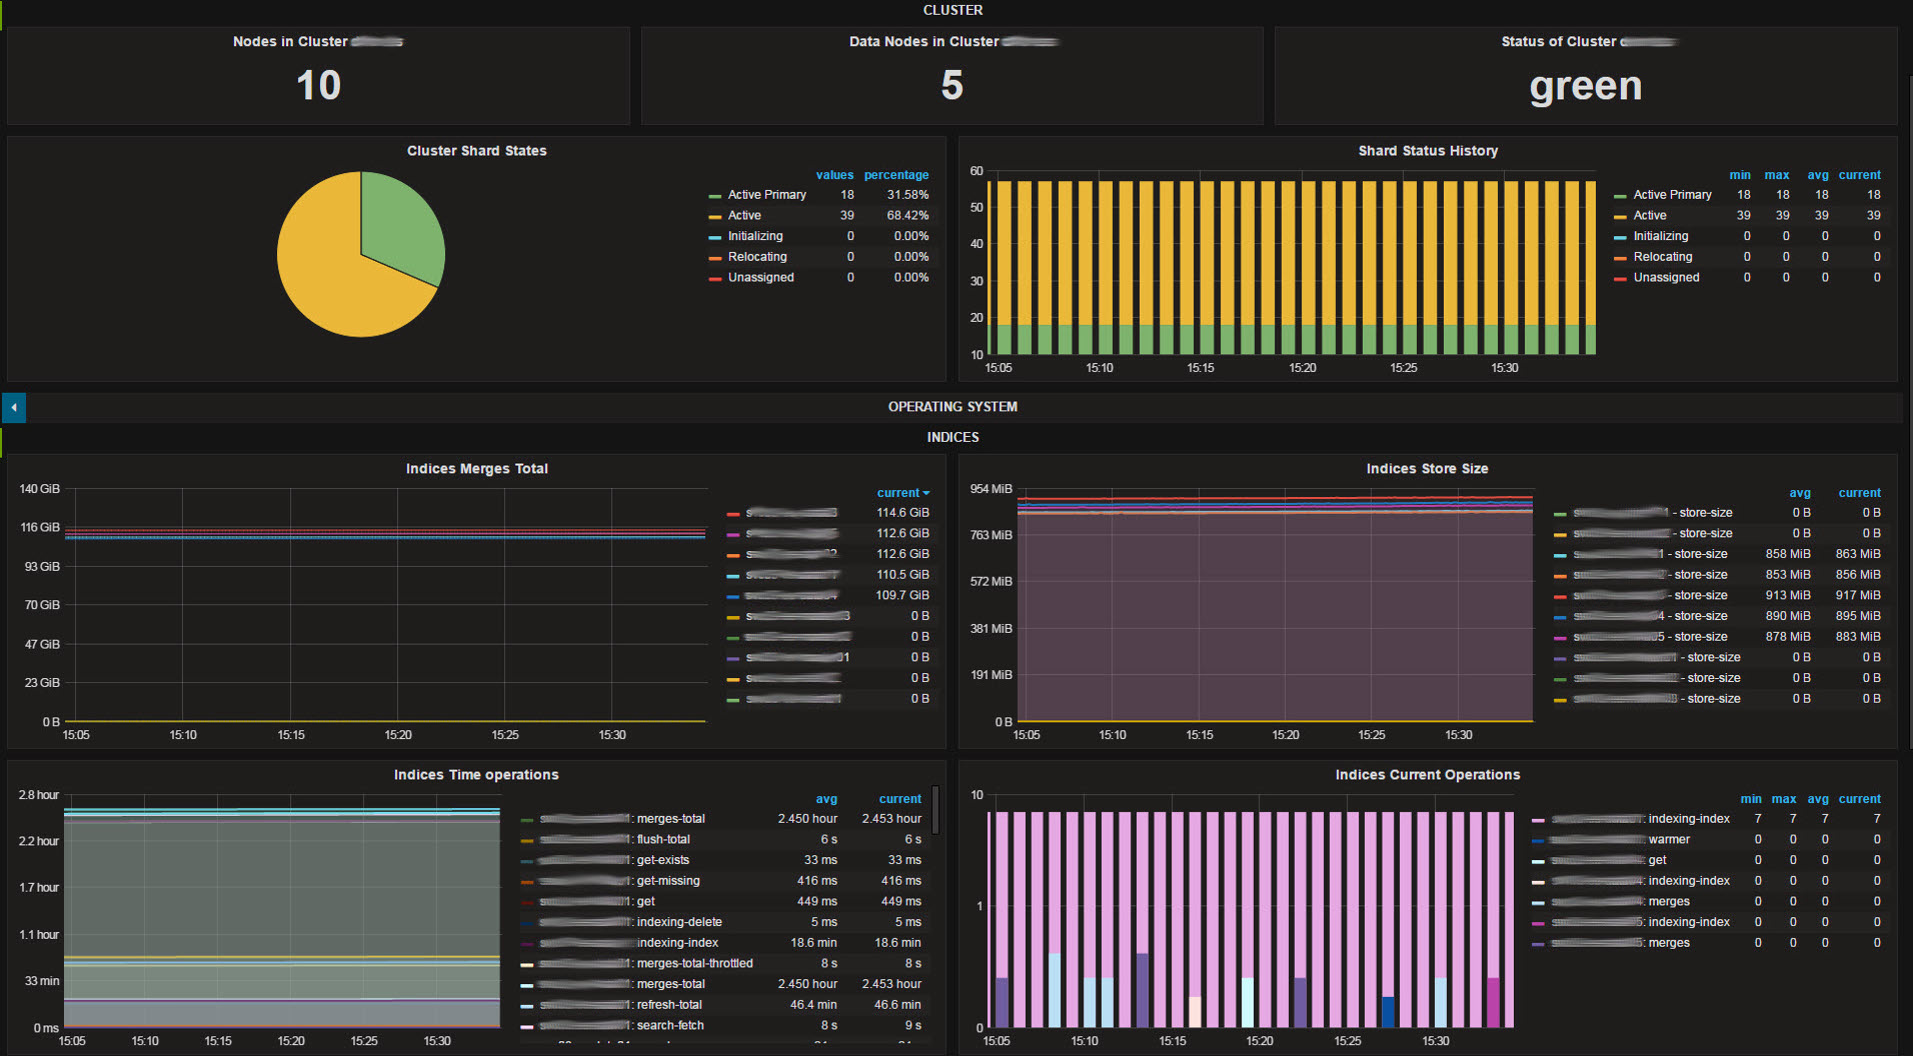
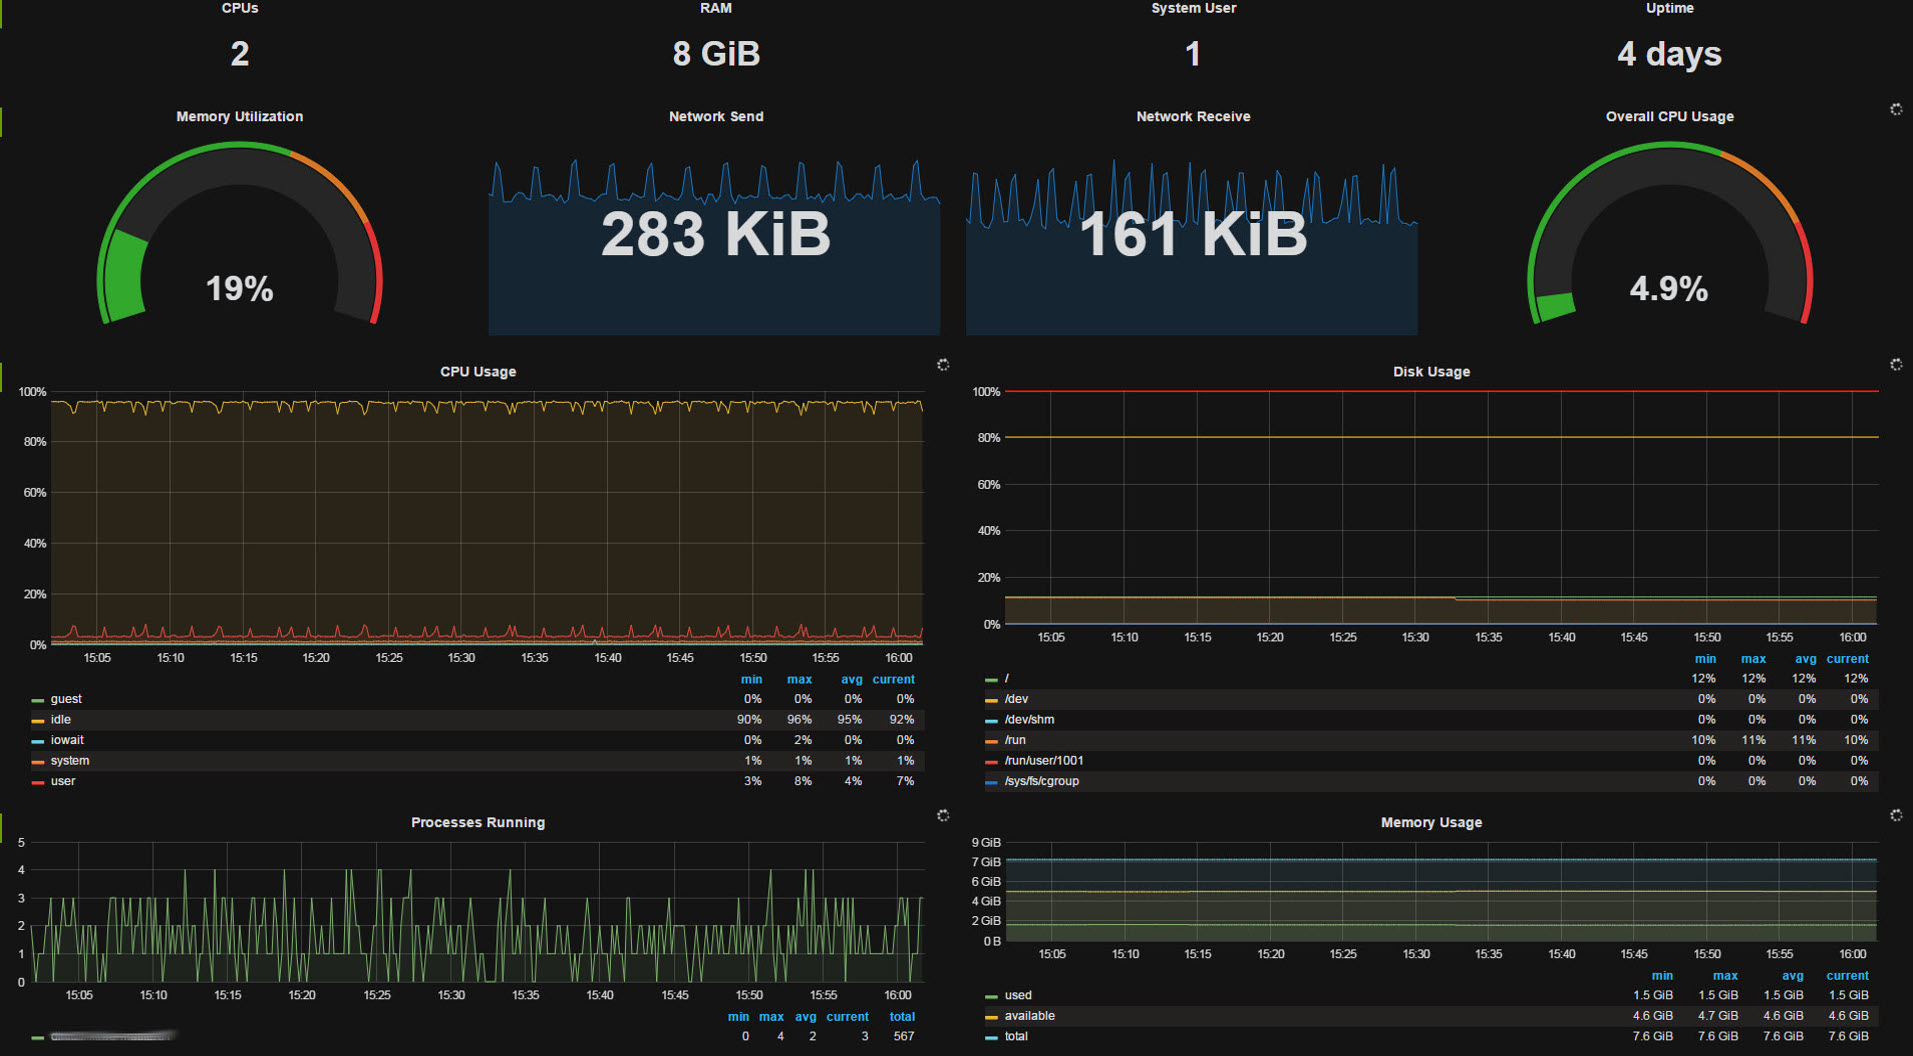
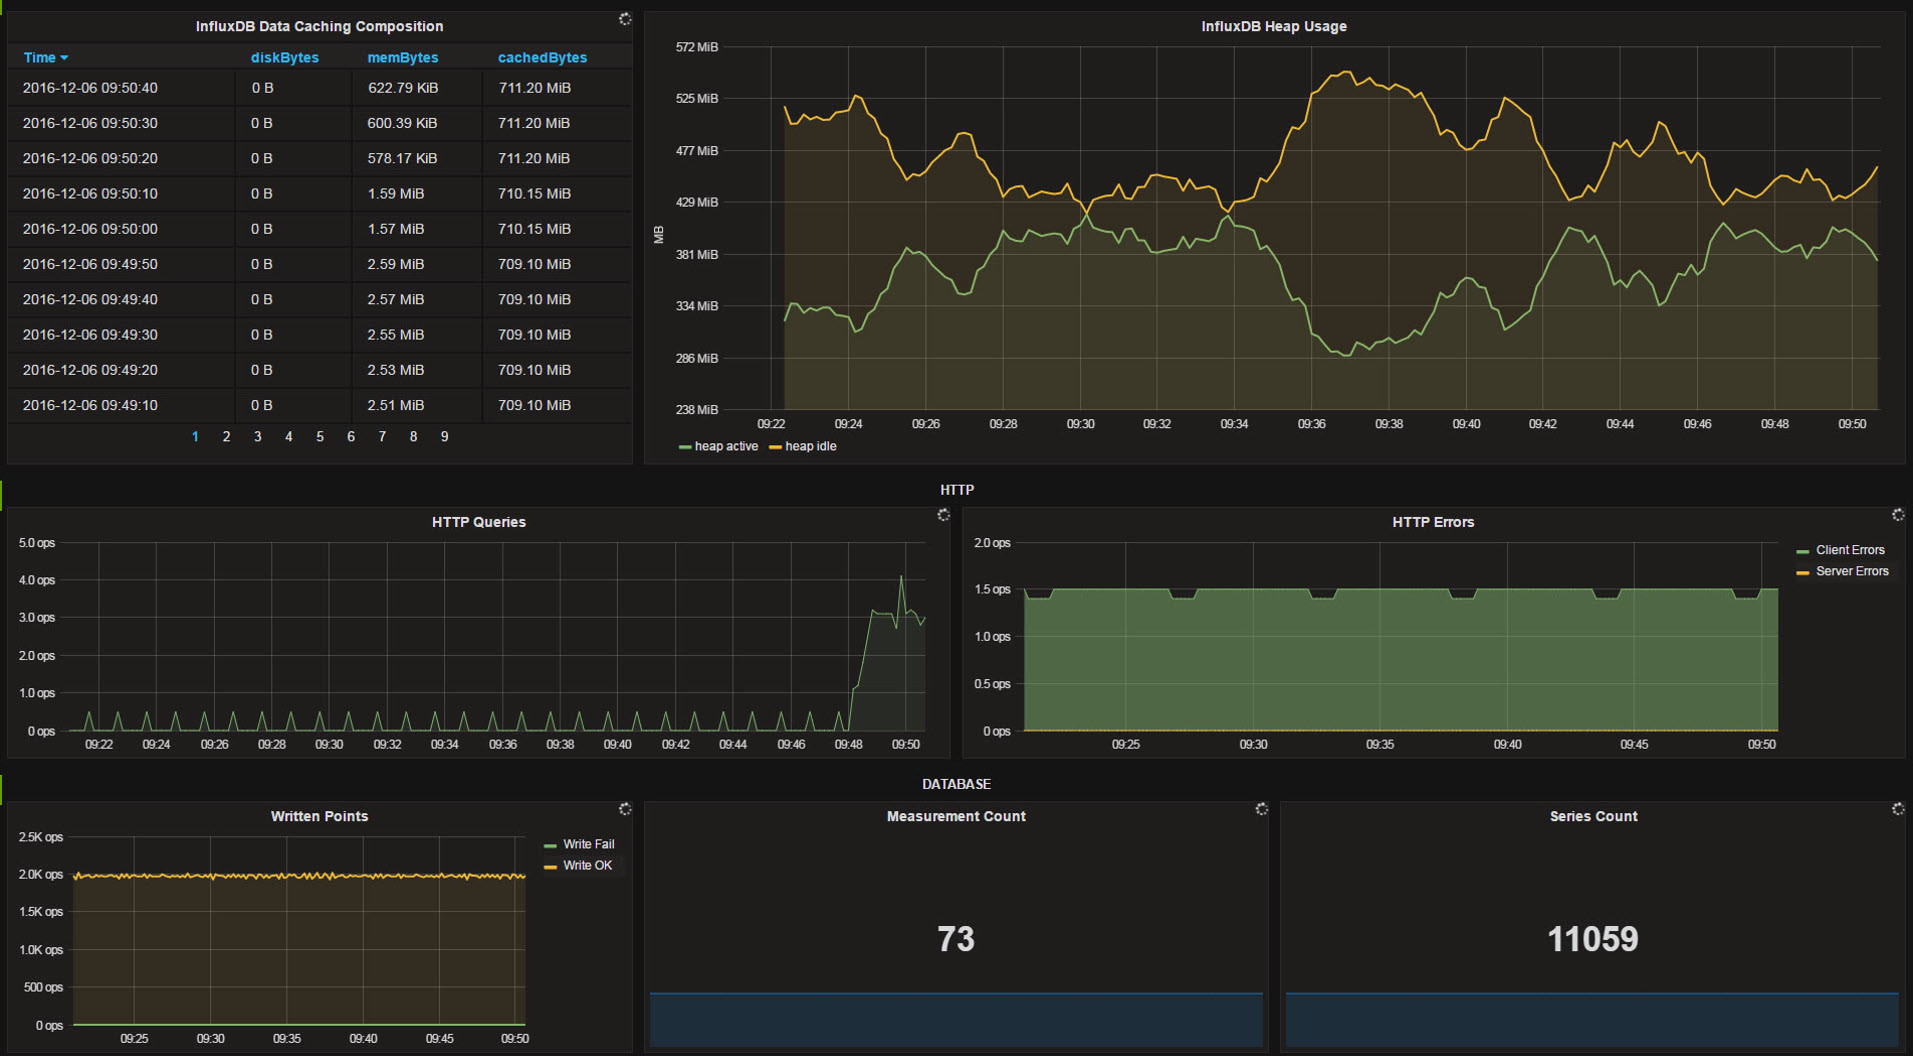
Since the dashboards are highly customized for our infrastructure, sharing wouldn’t make much sense. For more generic, ready to use dashboards you can visit grafana.net and download some pretty neat dashboards to save yourself some time. See the screenshots as a kick for your imagination. After having all your systems sending metrics to your InfluxDB, creating Dashboards and checking out what you can do with you new toys can be quite satisfying.
Python
Now that we have everything up and running, we will sooner or later encounter problems that can’t be solved directly by our used tools. I for example wanted some more informations from our Kubernetes clusters than I could get out of the corresponding plugin. Also some of those informations were not metrics, but strings or bools. You can store them in your InfluxDB as well! Ok, let’s look at a practical example:
The Kubernetes API Server monitors the components needed for a Kubernetes Master internally and exposes them via it’s API. Thats sound like a good way to get alerted if our controller manager, scheduler oder ETCD server having problems! Telegraf can execute external scripts and programs, they just have to return valid InfluxDB line protocol data to stdout. So, let’s create a small Python script that get’s us the required informations:
#!/usr/bin/env python
# -*- coding: utf-8 -*-

import argparse
import requests

__version__ = '0.1'


class KubeStatus(object):
    def __init__(self, args):
        self.args = args

    def _get(self, url):
        try:
            resp = requests.get(url, timeout=int(self.args.timeout))
        except requests.exceptions.Timeout:
            resp = object()
            resp.timeout = True
        except requests.exceptions.RequestException:
            resp = object()
            resp.error = True
        finally:
            return resp

    def get_component_status(self):
        metrics = {}
        tags = {}

        resp = self._get('{0}/api/v1/componentstatuses'.format(self.args.url))
        if getattr(resp, 'timeout', False):
            metrics['timeout'] = True
        elif getattr(resp, 'error', False):
            metrics['error'] = True
        else:
            data = resp.json()
            for component in data['items']:
                tags['name'] = component['metadata']['name']
                metrics['healthy'] = component['conditions'][0]['status']
                yield self._influxline('kube_components', metrics, tags)

    def _influxline(self, measurement, metrics, tags):
        values = []
        mtags = []

        for key, value in metrics.iteritems():
            if isinstance(value, basestring):
                fmt_str = '{0}="{1}"'.format(key, value)
            else:
                fmt_str = '{0}={1}'.format(key, value)
            values.append(fmt_str)

        for key, value in tags.iteritems():
            fmt_str = '{0}={1}'.format(key, value)
            mtags.append(fmt_str)

        return "{0},{1} {2}".format(measurement, ','.join(mtags), ','.join(values))


def main():
    parser = argparse.ArgumentParser()
    parser.add_argument('-v', '--version', action='version', version=__version__)
    parser.add_argument('-u', '--url', help='url to query', default='http://localhost:8080')
    parser.add_argument('-t', '--timeout', help='timeout in seconds', default=5)
    args = parser.parse_args()

    kubestatus = KubeStatus(args)
    for metric in kubestatus.get_component_status():
        print(metric)

if __name__ == '__main__':
    main()
This can easily be extended to gather health informations about nodes, pods and containers. The full script can be found here. Now we can call it from Telegraf and gather the metrics into our InfluxDB:
[[inputs.exec]]
  commands = ["/opt/monitoring/kube_status.py"]
  timeout = "5s"
  data_format = "influx"
We can now show the informations in our grafana dashboards (like shown in the screenshot of our kubernetes cluster dashboard). But more importantly we can create a TICKScript that is alerting us as soon as something goes wrong with our cluster:
// Parameters
var period = 10s
var every = 10s

// Dataframe
var data = stream
  |from()
    .database('telegraf')
    .retentionPolicy('autogen')
    .measurement('kube_components')
    .groupBy('cluster', 'datacenter', 'name')
  |window()
    .period(period)
    .every(every)

// Thresholds
var alert = data
  |alert()
    .id('kubernetes/{{ index .Tags "name"}}')
    .message('{{ .ID }}:{{ index .Fields "healthy" }}')
    .crit(lambda: bool("healthy") != TRUE)

// Alert
alert
  .alerta()
    .resource('{{ index .Tags "cluster" }}/kubernetes')
    .environment('{{ index .Tags "cluster" }}')
    .message('Kubernetes component {{ index .Tags "name" }} is {{ .Level }}')
    .group('{{ index .Tags "datacenter" }}')
    .value('{{ index .Fields "healthy" }}')
And here shows the true power of this kind of setup: We just added one TICKScript but every single Kubernetes cluster that sends it’s metrics to our InfluxDB is now beeing monitored for failures. As soon as a new cluster comes up, there is nothing todo, the monitoring, visualisation and alerting is already running. If a cluster is destroyed the alerts would stay in Alerta until someone deletes it, but we just hooked a script into our destruction process that clears old alerts via Alertas API and clears data from our InfluxDB. We can do that because we have full controll over everything that is happening. Every component has an API that we can talk to via all of our automation processes.
I hope you got an insight of what can be done using metric based monitoring and a completely OpenSource based software stack. Since we are chaining tools together mainly via well defined interfaces, changes specific to your infrastructure can be easily accomplished. Give it a try and decide for yourself if a transistion from check based monitoring is an option for you. For me it definitely was!